

Why the same methodology gives different results
Any serious valuation report relies on methodologies nobody disputes. Discounted cash flow, multiples of comparable listed companies and precedent transaction multiples are the common language of advisers, funds, banks and courts. That widespread acceptance can convey a sense of precision that the result does not always have.
In practice, two competent professionals, with the same information and the same methodologies, can reach valuations that differ by, say, 20% or 30% without either of them having made a technical error. The formulas are public and simple; the difference lies in the data that go into them, and almost none of those data are facts: they are estimates, selections and judgements.
A valuation is more reliable the better it identifies where its subjectivity lies, justifies it and puts it to the test. The risk arises when judgement is applied without being made explicit or when the result is not questioned.
Judgement and subjectivity in applying discounted cash flow
DCF is the most grounded method and, at the same time, the most sensitive to its assumptions. The methodology consists of valuing the company’s ability to generate future cash flows, brought to present value. The three fundamental components the method relies on are heavily affected by subjective criteria, as we will see below.
The business plan. It is the basis of everything and is almost never neutral. It is prepared or validated by the management team, who know the business better than anyone but also have incentives and biases. Sales growth rate, margin trends, capex investment and working capital needs are assumptions. Deciding whether to accept the plan as it is, adjust it or build an alternative scenario is the first and most important decision in the exercise.
The discount rate. WACC concentrates a good part of the model’s discretion. The risk-free rate allows for different references and maturities. The market risk premium varies depending on the source and the method. Beta is taken from a group of listed companies that is never identical to the company being valued. And then there are the additional premiums: for size, illiquidity, specific risk or dependence on the founder. Whether to apply them, and by how much, can move the rate by several points.
The terminal value. In most valuations of growing companies it accounts for more than half of the value, often between 60% and 80%. It depends on two variables, WACC and perpetual growth, which are hard to estimate precisely. The table (based on an example) shows how much the total value of the company moves under reasonable variations of both, starting from a WACC of 10% and perpetual growth of 2% (“g”):
| WACC \ Perpetual growth | 1.5% | 2.0% | 2.5% |
|---|---|---|---|
| 9% | +9% | +15% | +21% |
| 10% | −4% | Base | +5% |
| 11% | −15% | −11% | −8% |
Change in the total value of the company compared with the base case. Five-year projection with cash flows growing 5% a year and terminal value using the Gordon model, which in the base case accounts for 70% of the value. Illustrative example.
All nine combinations are defensible and any of them could appear in a well-prepared report. The difference between the lowest and highest is around 36 points of the company’s total value.
Judgement and subjectivity in applying multiples
Applying multiples starts from real prices paid by third parties or the real market capitalisation of listed companies, and between the price of someone else’s deal and the value of a specific company there are several layers of selection and adjustment.
The first is what counts as comparable. A Spanish industrial distributor with 40 million in sales rarely has an exact listed equivalent. Listed companies in the sector tend to be much larger, more geographically diversified and with very different access to capital. Precedent transactions are closer in size, but their information is partial and each one carries synergies, market contexts and structures that are not repeated.
The second is what is discarded. Almost any sample includes values that stray from the average: a deal paid with an exceptional strategic premium, a listed company in restructuring, a transaction closed at the 2021 peak. Removing them may be correct, because they distort the benchmark. Each exclusion is a decision, and the result changes depending on which ones are removed and on what grounds. A sample of twelve comparables that is down to seven after cleaning is more a reasoned selection than a market fact.
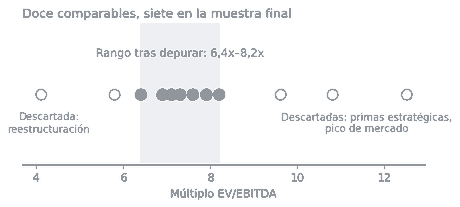
The third is how the multiple is carried over to the company. Mean or median, historical or forward multiple, reported or normalised EBITDA. And, above all, what discount or premium is applied for size, quality of financial information, customer concentration or dependence on the founder. The market benchmark provides a starting point; judgement decides the position within the range.
“Valuation formulas are public and fit on a single line. What sets one valuation apart from another are the dozens of decisions behind every figure that goes into them.”
Stepping back: does the result make sense?
A model can be perfectly built and still produce a result that makes no sense. Spreadsheets faithfully reproduce assumptions that may be inconsistent with one another. That is why, once the calculation is done, it pays to step away from the detail and look at the big conclusions, cash-flow movements, introduce checks, etc.
Five questions help to do this.
What multiple does the DCF imply? If the discounted cash flow gives a value equivalent to “n” times EBITDA and transactions in the sector close substantially below “n” times, something has to explain the difference. There may be a good reason: growth well above that of the comparables, exceptional recurrence, a position that is hard to replicate. If there isn’t, the plan or the rate are most likely too optimistic.
How much does the terminal value weigh? When the terminal value exceeds 80% of the total, the valuation depends mainly on what happens beyond the projected horizon, which is what we know least about. It is also worth checking what exit multiple it implies: if the chosen perpetual growth is equivalent to selling in five years at a multiple nobody pays today, the assumption needs revisiting.
Is the plan consistent with the track record? A plan projecting 15% annual growth in a company that has grown at 4% over the last decade needs more than willpower. It could be a new plant, a signed contract, an acquisition or entry into a new market. If there is no identifiable driver, the plan is closer to a target than a forecast.
Does the organisation have the capacity to execute it? Doubling the size of a company requires people, systems and financing. A plan that assumes that leap with the same management structure, without investing in people or processes, overestimates what the company can do. It is not credible in the context of a sale process.
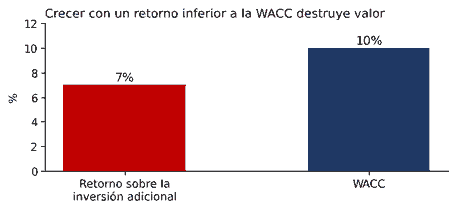
Does growth deliver the expected return? This is the most important question and the one asked least. Growth only creates value if the return on the capital it consumes exceeds its cost. Suppose a plan takes EBITDA from 5 to 8 million in five years but requires investing 25 million in capex and working capital. After tax and maintenance reinvestment, those additional 3 million may translate into around 1.8 million of net operating profit: a 7% return on the investment. With a WACC of 10%, that growth destroys value, even though sales grow strongly. A plan that grows a lot and returns little does not justify a high price, and an experienced buyer will spot it.
These tests complement the calculation and make it possible to tell a valuation that holds up in a negotiation from one that falls apart at the first awkward question.
What this means for sellers and buyers
For the business owner who commissions a valuation, the practical conclusion is that the final figure matters less than the reasoning behind it. A figure without explicit assumptions is no use in a negotiation: the first buyer to challenge it will take it apart, and the seller’s credibility with it. A valuation that identifies its key assumptions, shows how the result changes if they move and explains why they were chosen becomes a negotiating tool.
For buyers, the logic is the same from the other side. Behind an asking price there is always a business plan and a discount rate. Identifying which assumptions support it, and which are debatable, is the most effective way to bring positions closer without breaking off the conversation.
In both cases, the skill that makes the difference is knowing when to distrust the model. It requires having seen many business plans come true and many more fail to; having been at the table where a buyer takes a valuation apart and where they accept it. That judgement, which no formula captures, is what turns a correct calculation into a valuation you can trust.


